Understanding Pre-Pandemic NAEP Trends: Setting the Stage for NAEP 2022
America is facing a crisis in education—whether it’s learning loss or missing learning. Our nation must understand the crisis completely to create the solution completely. The National Assessment of Educational Progress (NAEP) provides the context for leaders to grasp the entire problem, from before COVID to now.
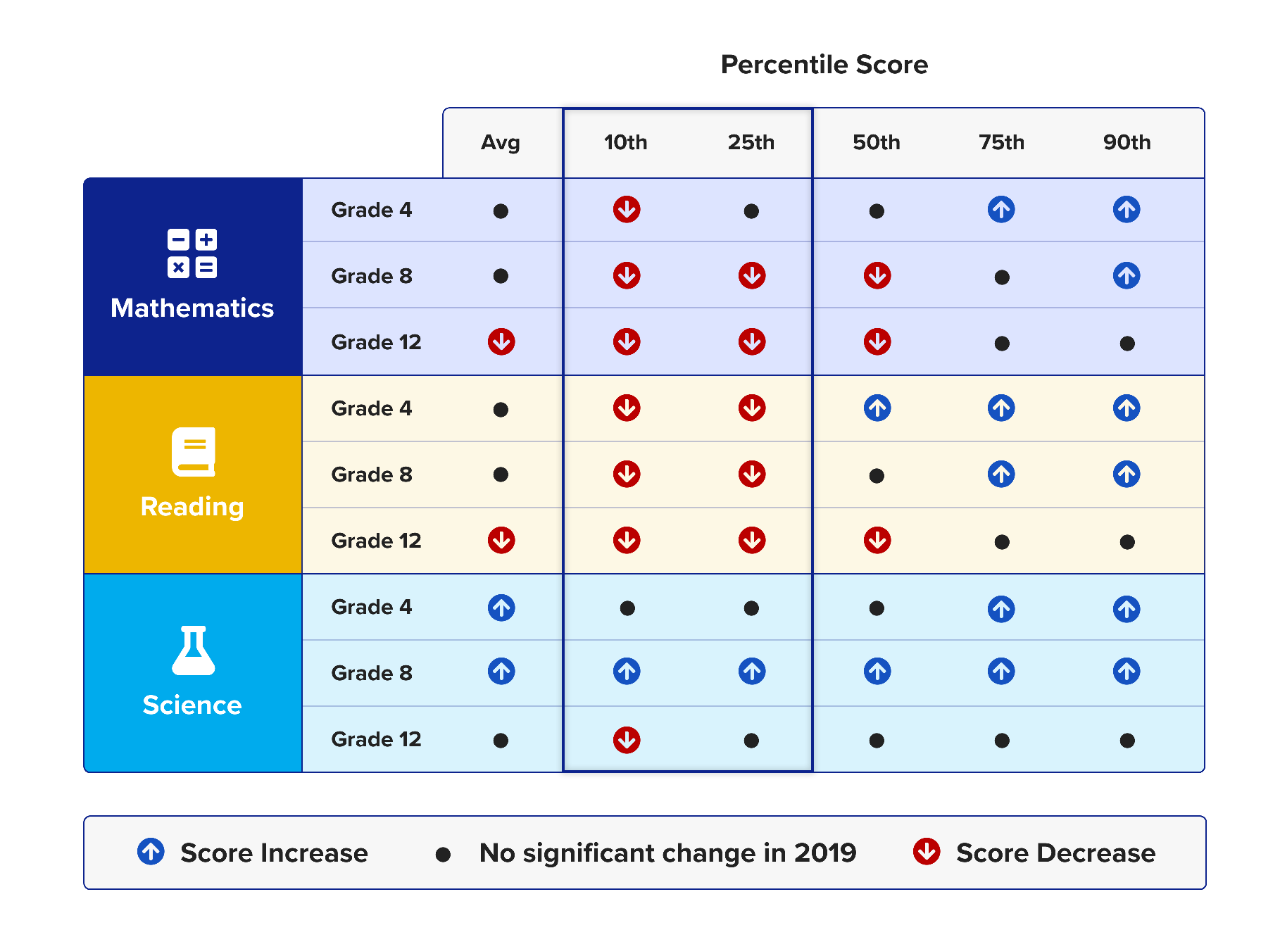
The divide between our nation’s highest- and lowest-performing students has widened in multiple grades and subjects.
- These trends emerge in grades 4 and 8 NAEP mathematics and reading, which show little change in average scores from 2009 to 2019 but clear patterns of divergence between lower- and higher-performers.
Changes in average and selected percentile scores, by assessment: 2009-2019

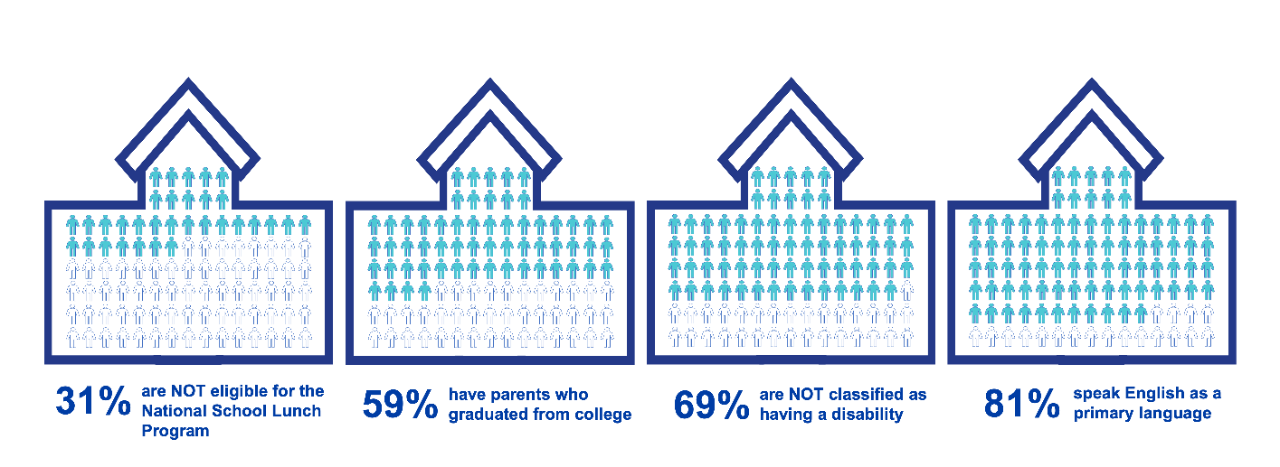
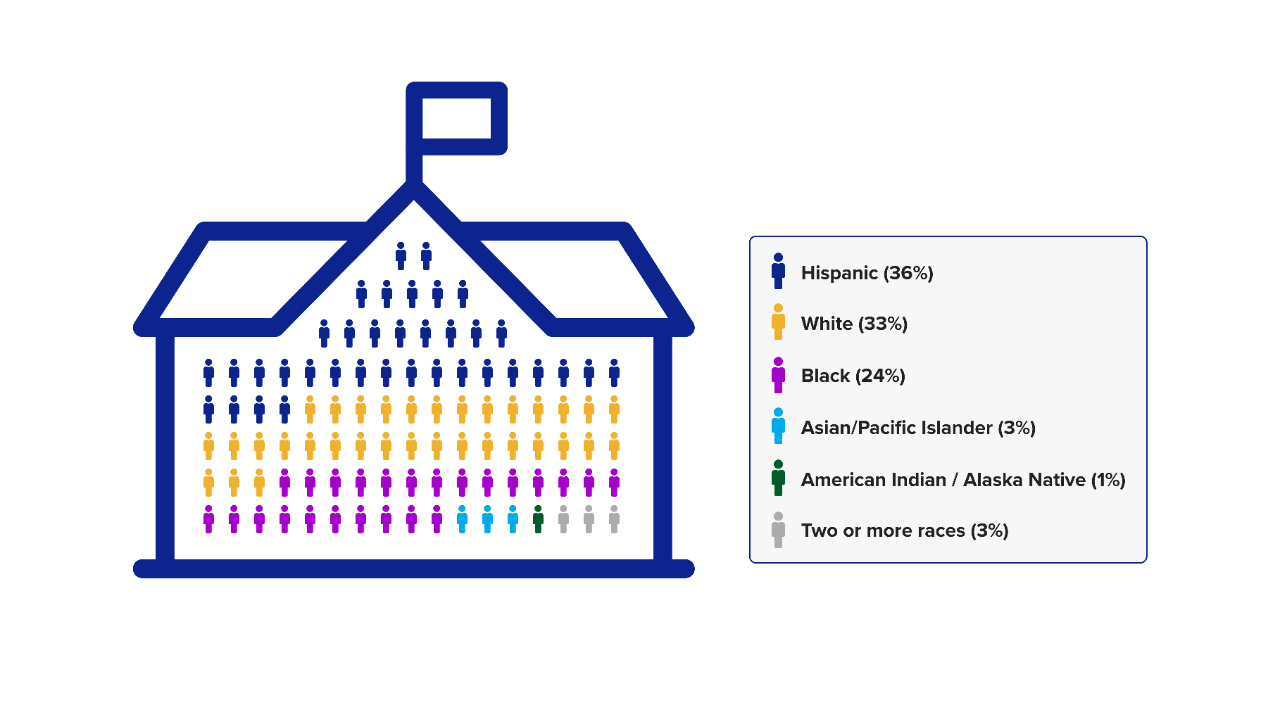
The nation’s lower-performing students are diverse across race, ethnicity, and parent educational backgrounds.
Selected Characteristics of Lower-Performing Students

Racial/ethnic composition of students who performed below the 25th percentile

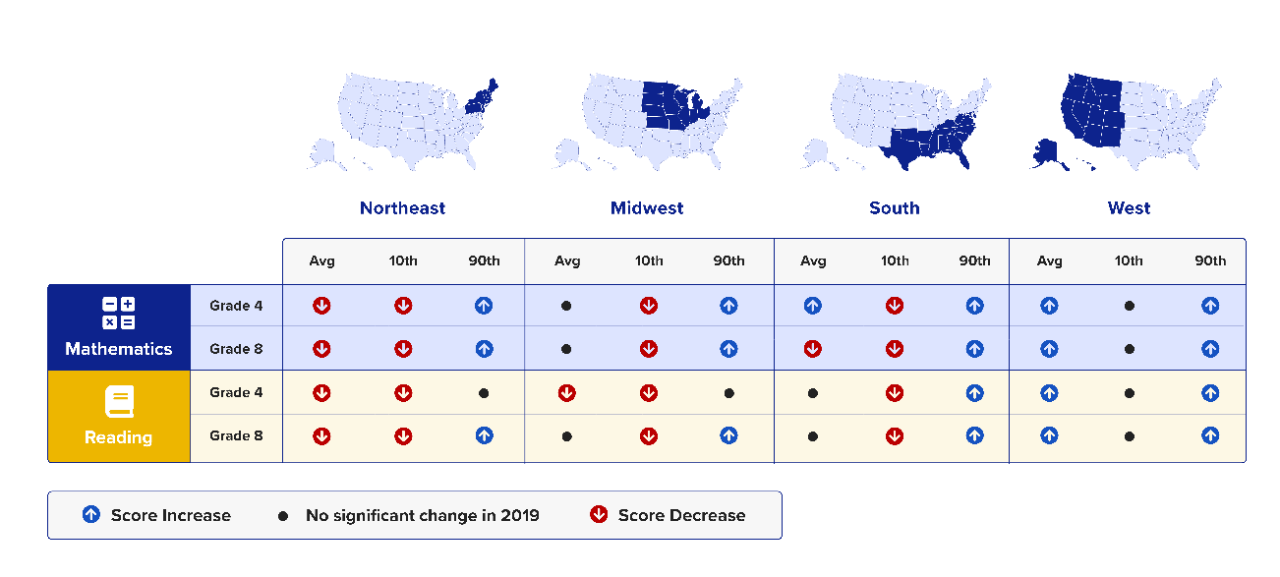
And the nation’s lowest-performing students live in different regions and states.
Changes in selected percentile scores, by region and assessment: 2009-2019

Note: “Highest-performing” refers to students scoring at or above the 90th percentile. “Lowest-performing” refers to students scoring at or below the 10th percentile.
Find out more at nationsreportcard.gov.
NAEP, also known as The Nation’s Report Card, is the longest-running, nationally-representative assessment program for the nation, for states and jurisdictions, and for 27 urban districts.

