
A Primer on Attendance and Absenteeism on the Nation’s Report Card and Beyond
A Primer on Attendance and Chronic Absenteeism on the Nation’s Report Card and Beyond
Historic declines in student achievement present our most pressing problem in education today. But closely connected to that, and as urgent, is a steep rise in chronic absenteeism.
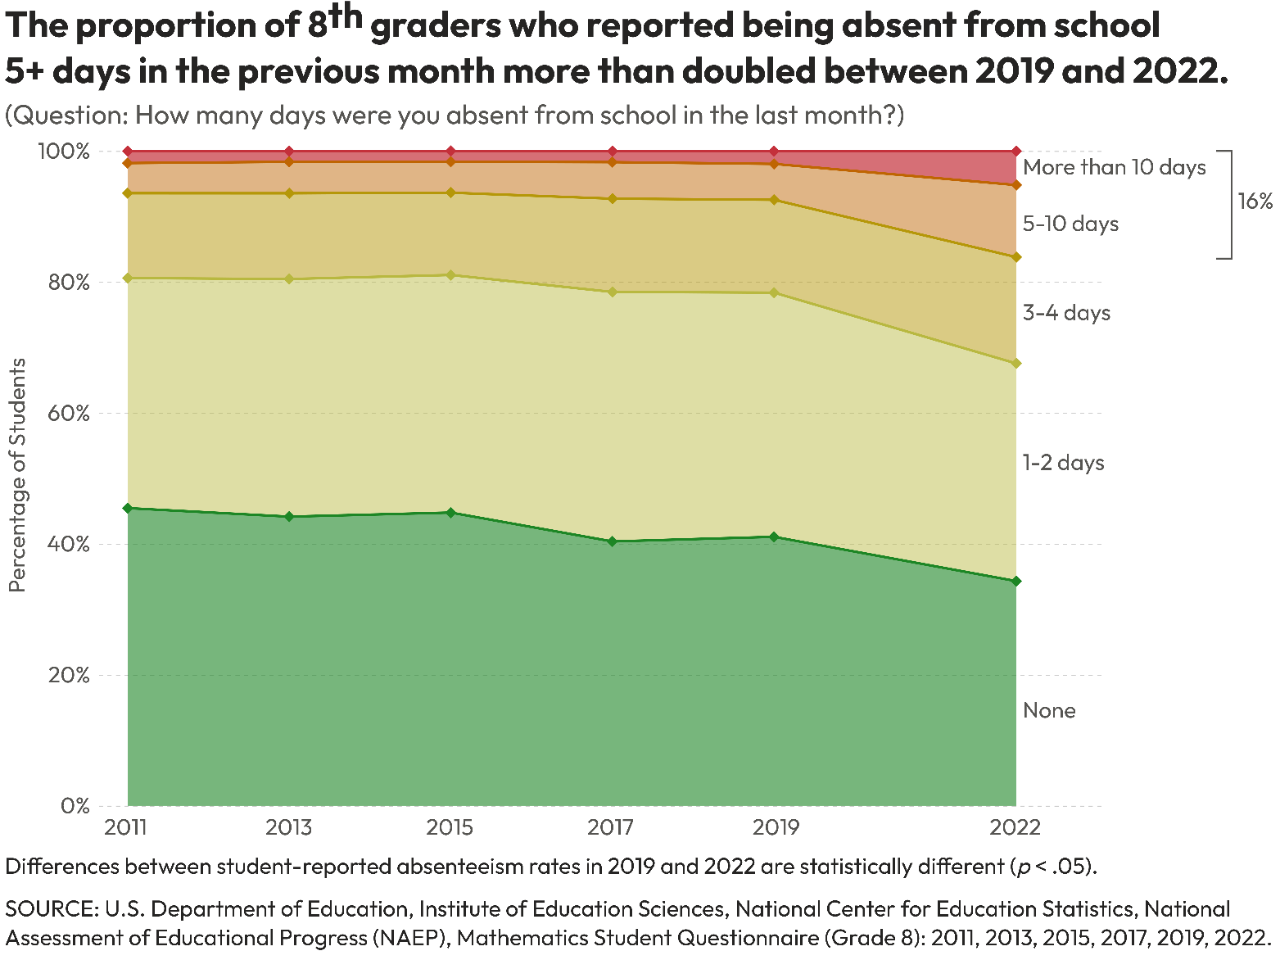
On the most recent Nation's Report Card, or National Assessment of Educational Progress (NAEP), 22% of 4th graders reported they were absent five or more days in the previous month. That is double the percentage who reported that in 2019. The results were similar for eighth-graders and similar across states and subgroups of students.
The survey findings correspond with other data showing a rise in chronic absenteeism, making it one of the biggest obstacles to the nation’s post-COVID academic recovery. For example, 72% of schools reported an increase in the 2021-22 school year compared to pre-pandemic levels, according to the School Pulse Panel*, another national survey. And while research shows chronic absentee rates improved across states in 2023, they still remain 75% higher than before the pandemic. The National Center for Educational Statistics (NCES) sees an association between the rise in absenteeism and decline in student achievement.
If students aren’t in school, how can they learn? Experts predict academic recovery will be nearly impossible if chronic absenteeism persists.
As is the case when tackling achievement declines, schools should use data to drive decisions around policies and practices to improve attendance.
*Approximately 2,400 public elementary, middle, high, and combined-grade schools were sampled for the monthly data collection. While the results presented in the dashboard have been weighted and adjusted for non-response, these experimental data should be interpreted with caution. Experimental data may not meet all NCES quality standards. Learn more about School Pulse Panel.
How Student Attendance and Chronic Absenteeism are Captured on the Nation’s Report Card
The Nation’s Report Card, coming out early 2025, includes three survey questions on absenteeism at all grades for students, teachers, and administrators.
2024 NAEP Student Question
This has been asked on the student questionnaire since 2003.
How many days were you absent from school in the last month?
- None
- 1 or 2 days
- 3 or 4 days
- 5 to 10 days
- More than 10 days
2024 NAEP Teacher Question
This is new to the 2024 administration of NAEP. The findings are in terms of percentage of students. It is appropriate to state, “X% of students had teachers who reported that Y% of students have been absent from school 10% or more of all school days.”
During this school year, what percentage of your students have been absent from school 10% or more of all school days?
- None
- 1–5%
- 6–10%
- 11–25%
- 26–50%
- 51–75%
- 76–90%
- Over 90%
2024 NAEP School Administrator Question
This is new to the 2024 administration of NAEP. The findings are in terms of percentage of students. It is appropriate to state, “X% of students had administrators who reported that Y% of students have been absent from school 10% or more of all school days.” A similar question was asked in previous years**, but this new item may not be linked to the previous question and results.
During this school year, what percentage of your students have been absent from school 10% or more of all school days?
- None
- 1–5%
- 6–10%
- 11–25%
- 26–50%
- 51–75%
- 76–90%
- Over 90%
**The previous administrator question was, ‘About what percentage of your students is absent on an average day? (Include excused and unexcused absences).” Response categories were: 0-2%; 3-5%, 6-10%, and more than 10%. A key difference is the previous question asked about “the average day,” instead of considering the full school year.
Absenteeism and NAEP Achievement Association
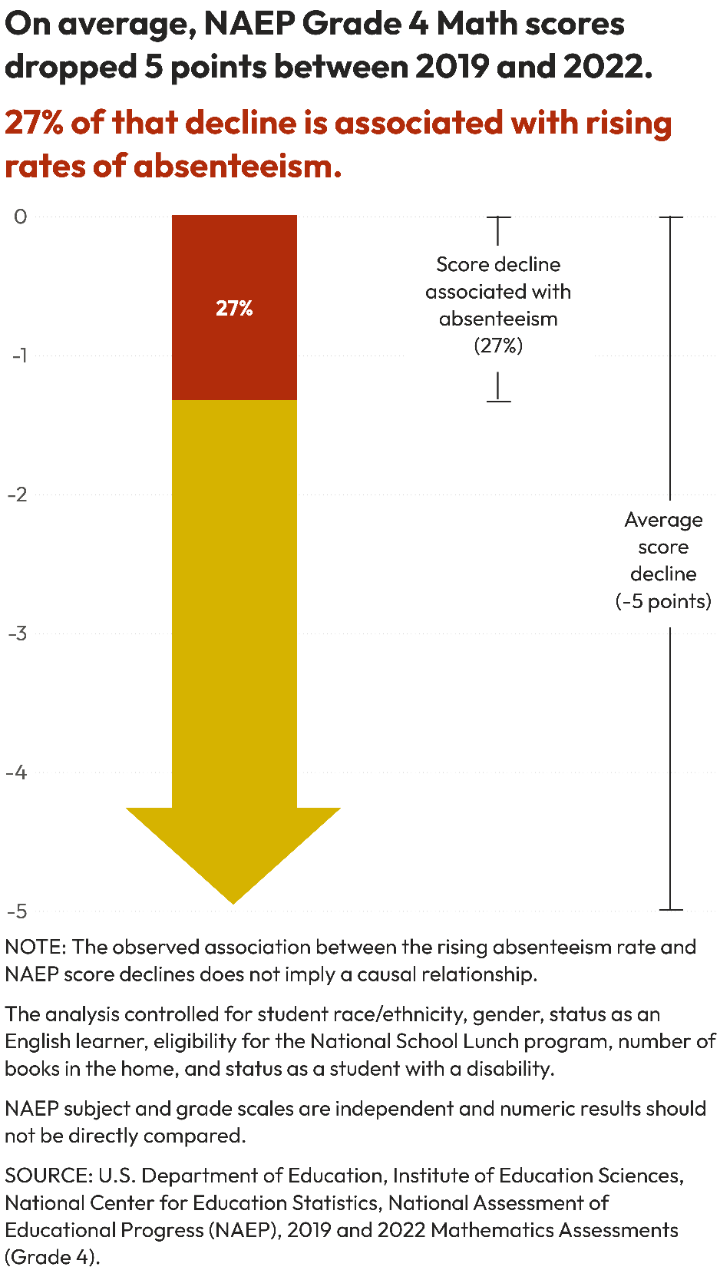
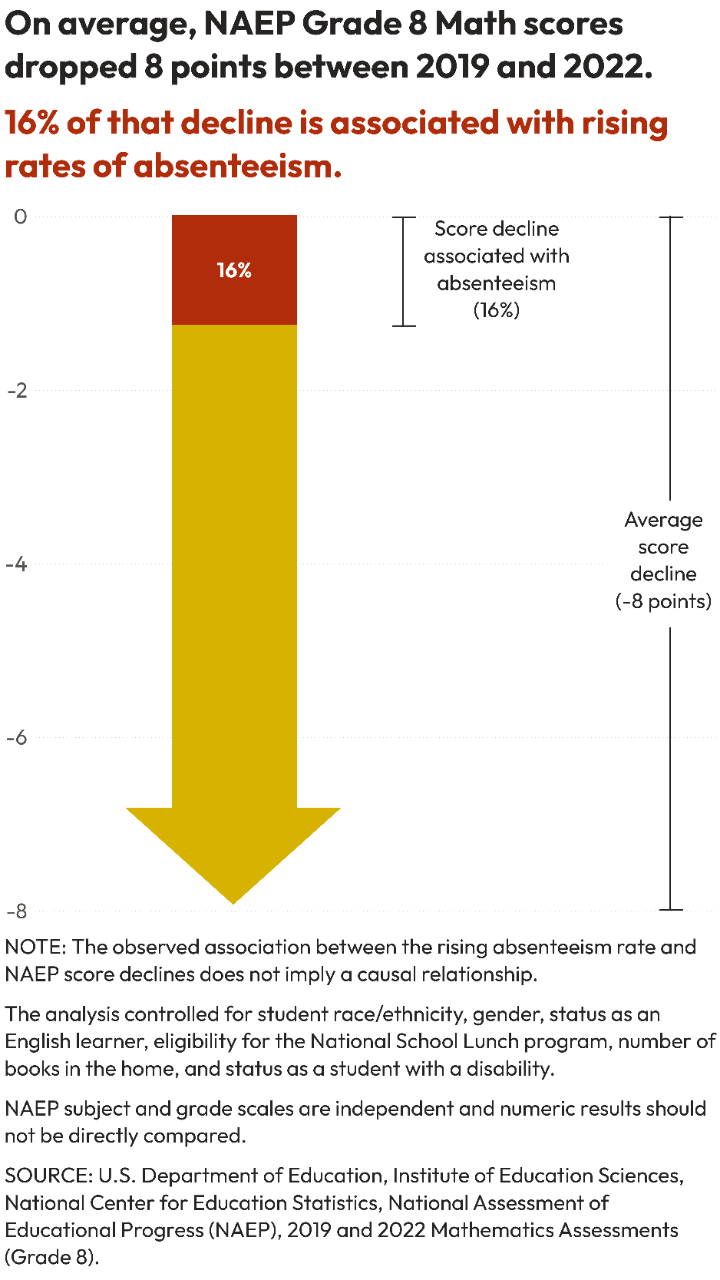
The 2022 Nation’s Report Card shows an association between student absenteeism and declines in NAEP scores. Controlling for shifts in demographics, NCES finds that the percentage of score declines between 2019 and 2022 associated with absenteeism are:
- 4th grade: 27% of the 5 point drop in math and 45% of the 3 point drop in reading.
- 8th grade: 16% of the 8 point drop in math and 36% of the 3 point drop in reading.
Attendance and Chronic Absenteeism Research Questions for the Field
The Nation’s Report Card is a catalyst to improve student achievement. Researchers, in particular, can provide thoughtful analyses to leaders and practitioners using NAEP data. The following questions for the field focus on what to consider about attendance and student learning, both using the Nation’s Report Card and other data sources, like state and district attendance data.
Key Questions on Attendance and Chronic Absenteeism using NAEP data
- What is the link between reported attendance and NAEP score changes on the 2024 Nation’s Report Card, due out in early 2025?
- How does socioeconomic status and economic disadvantage relate to reported attendance?
- How do student-, teacher-, and administrator- reported attendance rates converge or diverge?
- Where across the nation are the highest levels of reported absences? By region? By state?
- What subgroups report the most frequent absences? What is the interaction of those subgroup patterns with economic disadvantage?
- Among students who report the most absences, on what subscales for math do they see the greatest declines?
Key Questions on Attendance and Chronic Absenteeism using other data sources (such as state or district data)
- For states that created policies to boost attendance, how have attendance patterns changed since policy enactment?
- How do student absenteeism and teacher absenteeism relate to each other? Between student absenteeism and teacher satisfaction?
- How much variation in attendance is there at the school, district, and state levels? How much of the variation in reported attendance is explained by differences in the school students attend, their school district, and their state?
- How do district policies on student absences influence teacher absences? Do increased teacher absences lead to increased student absences?
Schools and districts track daily attendance for students, often taken once a day, and sometimes for older students, by class period.
Average Daily Attendance (ADA) is the total days of student attendance divided by the number of instructional days for the specified time period. This measure is sometimes used in funding formulas (instead of enrollment, or how many students are enrolled in a school or district.)
Students are absent from school for excused or unexcused reasons. There are no standard definitions of excused and unexcused absences as these are determined by schools, districts, and states and therefore data are not comparable across or even within states.
- Excused absences commonly include missing school due to an illness (sometimes requiring a doctor’s note), observance of a religious holiday, or a death in a student’s immediate family.
- Unexcused absences are any absences that do not meet the definition of a school or district’s excused absence policies***. If schools track attendance by class period, sometimes common in high school, a student could be marked absent if they miss too many class periods (if they are late to school, leave early, or “skip” a class).
***Truancy is defined as being absent from school more often than what is accepted by a school or district’s policy. There is no standard or federal definition for truancy; however, states were required to report rates to the U.S. Department of Education with the passage of No Child Left Behind in 2001 through 2015, when ESSA reporting requirements transitioned to chronic absenteeism rates.
Chronic Absenteeism is now typically defined as being absent from school for at least 10% of instructional days regardless as to why a student missed school. (States sometimes measure this as a percent of days absent or a number of days absent that equate to 10%.) Chronic absenteeism includes both excused and unexcused absences and when students miss school due to suspension.
For the average school year of 180 days, this means being absent for 18 or more school days in a school year; or missing two or more days per month; or missing three weeks or more; or a month of school or more. However, there is no federal definition of chronic absenteeism.
Average Daily Attendance and chronic absenteeism are NOT the inverse of each other. If a school has an ADA rate of 90%, that means, on any given day, 90% of students are at school and 10% are absent. For a school of 500 students, that means 50 students or two entire classrooms are not present on a given school day. Nationally, the best estimates are that 26% of students are chronically absent, missing at least one month of school; and schools have a 90% ADA, meaning on any given day, 90% of students are in school, but some students may be absent at least 10% of their school days.
- EdData Express within the U.S. Department of Education has data on the 2021-22 school year, where 14.7 million students were chronically absent from school.
- National Assessment of Educational Progress (NAEP) has 2022 self-reported survey data for 4th and 8th grade students nationally, at the state level, and for 26 large urban districts. The 2024 NAEP includes questions for students, teachers, and school administrators about chronic absenteeis
- School Pulse Panel, administered by the National Center for Education Statistics, finds that 72% of all public schools reported that chronic absenteeism “increased a little” or “increased a lot” compared to a typical pre-pandemic school year..
- Under Title I, states are required to report rates of chronic absenteeism. However, the definition of chronic absenteeism can differ state-to-state. Thirty-six states and DC use chronic absenteeism as an accountability measure of student success or school quality metric under the Every Student Succeeds Act (ESSA).
- Rhode Island publishes the Student Attendance Leaderboard and other dashboards, providing real-time attendance rates by school for the current school year.
Research Resources from AttendanceWorks
AttendanceWorks
Ready to Learn Tracker Chronic Absenteeism: 2017-2023
AEI/CCiLong COVID for Public Schools: Chronic Absenteeism Before and After the Pandemic
Nat Malkus/AEI
Attendance Legislation in the United States
Lauren Burr, Mark Ziegler-Thayer, and Jenny Scala/AIR
Higher chronic absenteeism threatens academic recovery from the COVID-19 pandemic
Thomas Dee/Stanford University
Chronic Absenteeism in the Classroom Context: Effects on Achievement
Michael Gottfried/University of Pennsylvania


